Grape Seed Extract OPC Content: Why Test Methods Change the Result
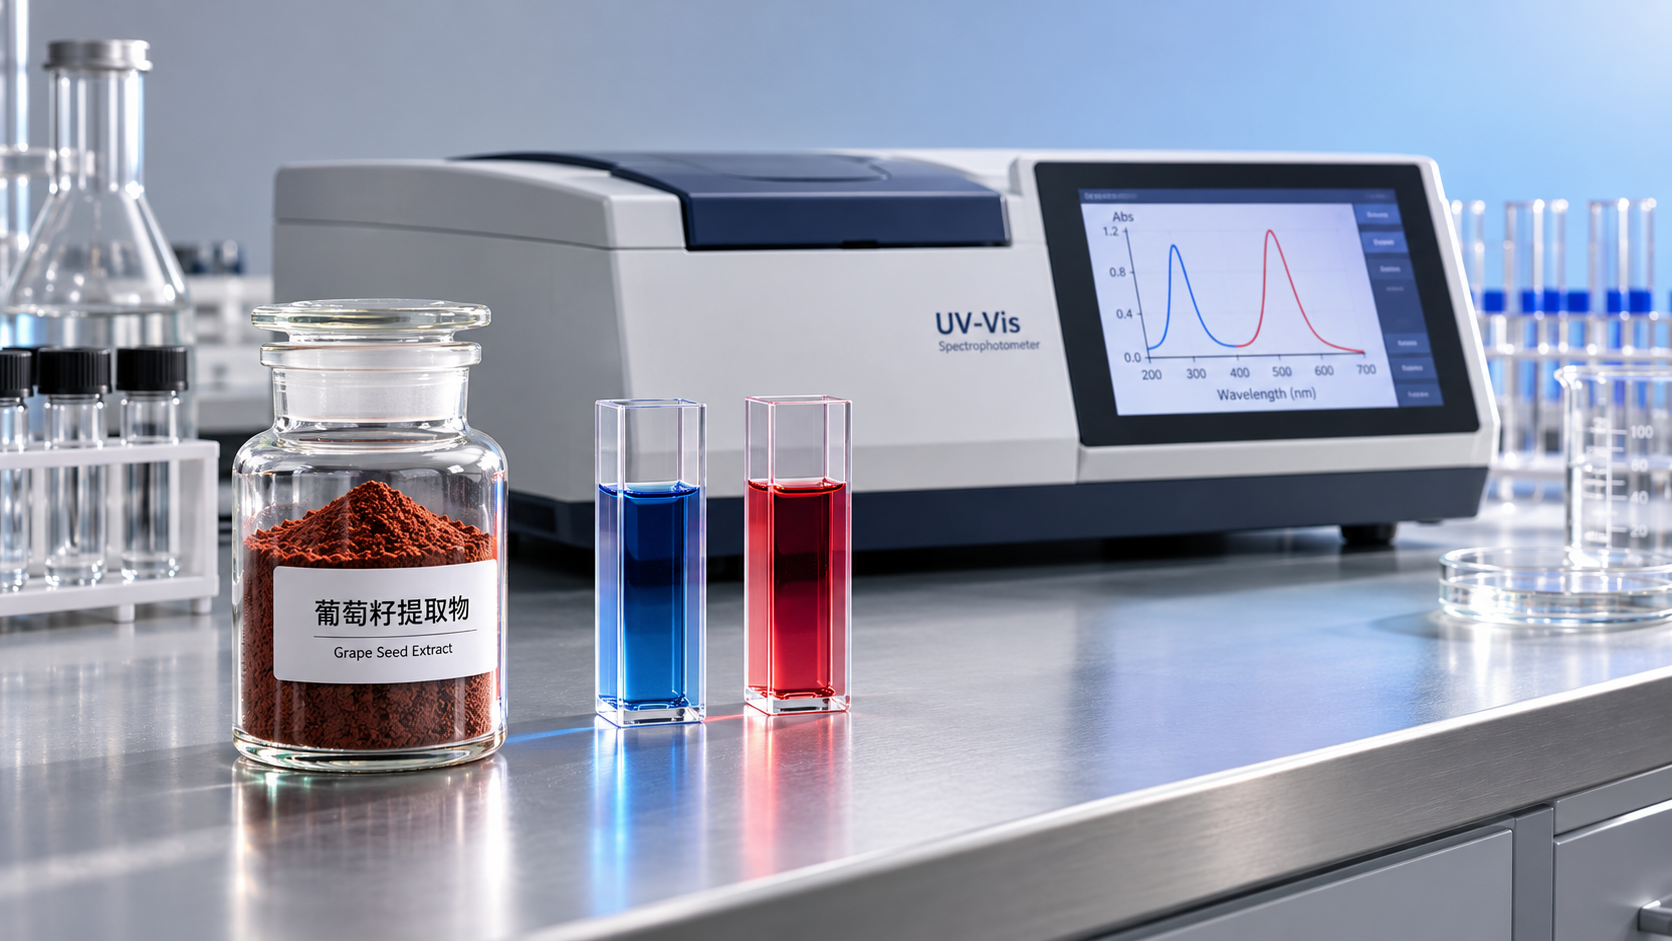
A high OPC percentage on a Grape Seed Extract certificate of analysis does not necessarily mean a higher concentration of oligomeric proanthocyanidins. The number depends on what the assay detects, how the sample is prepared, which reference material is used, and how the result is calculated. Two percentages generated by different methods may describe different analytical properties rather than different levels of the same constituent.
The decisive question is therefore not simply “What is the OPC content?” but “What exactly does this result measure?” A defensible comparison requires a defined measurand—the quantity being measured—and a sufficiently detailed method. Without those, ranking materials by their reported percentages can reward differences in analytical response instead of differences in composition.
“OPC” is not a single, uniformly defined analytical target
Grape seed proanthocyanidins are mixtures of flavan-3-ol units, principally based on catechin and epicatechin, with variation in chain length, galloylation, and linkage structure. An extract can contain free monomers, dimers, larger oligomers, and polymeric material alongside other extract components.
The abbreviation OPC generally means oligomeric proanthocyanidins, but the boundary between an oligomer and a polymer is not applied consistently across commercial specifications. One specification may define an explicit degree-of-polymerization range; another may use “OPC” as a broad label for a colorimetric proanthocyanidin result.
This distinction matters because detecting proanthocyanidins is not the same as selectively quantifying their oligomeric fraction. An assay that responds to both oligomers and polymers cannot establish an oligomer-only percentage unless a validated separation or another suitable differentiation step is included.
A specification should therefore identify whether the target is total polyphenols, total proanthocyanidins, a defined oligomer fraction, or selected individual compounds. Those terms are not interchangeable.
Why common assays produce different answers
Analytical methods translate a chemical response into a reported concentration. Different reactions respond to different structural features, and their response factors need not remain constant across the components of an extract.
Folin–Ciocalteu: total phenolics are not OPC
The Folin–Ciocalteu assay is useful for characterizing a broad phenolic response, commonly expressed as gallic acid equivalents. However, nonphenolic reducing substances can also contribute. Even when the response comes predominantly from phenolics, it does not distinguish grape seed oligomers from monomers or other phenolic compounds.
A result expressed as gallic acid equivalents is a calibration-based equivalent value, not a direct gravimetric measurement of gallic acid or proanthocyanidins. Relabeling it “OPC purity” changes its apparent meaning without changing the underlying measurement.
Vanillin and DMAC: more targeted chemistry, but not universal mass measurements
Vanillin assays respond to flavan-3-ol structures, including free catechin and epicatechin. Acidity, solvent composition, water content, temperature, and reaction time affect color development. Structural differences also influence response, so catechin calibration does not automatically provide an accurate mass percentage for a heterogeneous proanthocyanidin mixture.
DMAC is more selective toward flavan-3-ols than a broad total-phenolics assay, but “more selective” does not mean “specific to oligomers.” Monomers can contribute, and response varies with molecular structure and degree of polymerization. Results calibrated against catechin, procyanidin B2, or a characterized proanthocyanidin preparation should not be treated as equivalent without supporting evidence.
Neither assay inherently counts every flavan-3-ol unit with identical efficiency. A change in chain-length distribution can therefore change the measured response even when the total mass of proanthocyanidin material remains similar.
Acid conversion: reaction yield becomes part of the answer
Butanol–HCl methods use acid treatment and heating to generate colored anthocyanidins from proanthocyanidins. The signal depends not only on how much material is present but also on conversion efficiency and the structures undergoing conversion.
Reaction temperature, heating duration, reagent composition, and sample solubility require control. Blank design also matters where the sample has native color. Because polymeric proanthocyanidins can contribute, an acid-conversion result does not independently establish the proportion that falls within a specified oligomer range.
HPLC improves discrimination only when the method defines the fraction
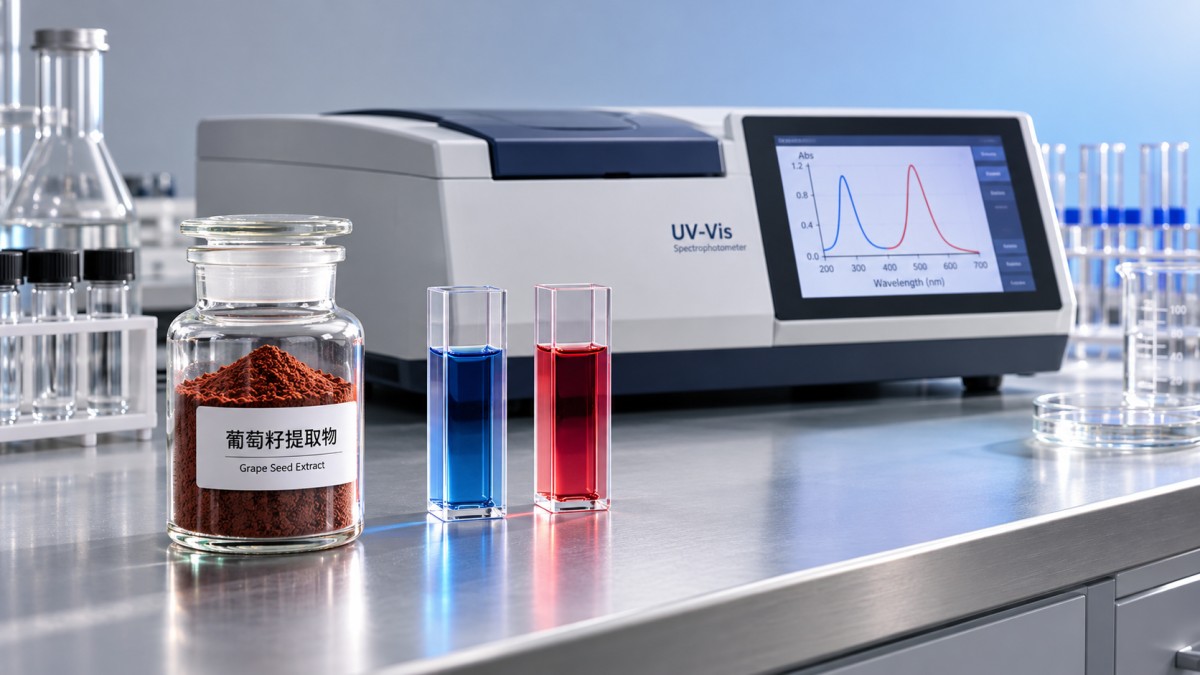
“Tested by HPLC” is not a complete analytical description. Reversed-phase methods can separate monomers and some lower oligomers, while normal-phase or hydrophilic-interaction approaches can separate material into degree-of-polymerization-related groups. Resolution and quantitative coverage remain method-dependent, especially for complex, higher-molecular-weight fractions.
A reported HPLC percentage might mean the sum of selected quantified compounds, a grouped fraction calculated against one standard, or normalized detector peak area. These results answer different questions.
Peak-area percentage is not automatically mass percentage. Detector responses can differ between compounds, and material that is poorly detected, unresolved, or excluded from integration may not appear in the denominator. A clean chromatogram is therefore insufficient evidence of a high oligomer mass fraction.
UV detection requires attention to response factors and coelution. Fluorescence detection can provide useful sensitivity, but response can vary with structure and experimental conditions. Mass spectrometry supports compound identification and distribution assessment, yet ionization efficiency and matrix effects prevent uncalibrated signal intensity from serving as a universal concentration measure.
Depolymerization techniques such as phloroglucinolysis or thiolysis, followed by chromatography, provide complementary information about subunit composition and mean degree of polymerization. They do not, by themselves, reveal the complete original chain-length distribution. Mixtures with different distributions can share a similar mean.
Where a claim specifically concerns oligomers, the analytical approach must resolve or otherwise substantiate the defined oligomer fraction. A broad assay can remain useful for routine control, but it should not be asked to prove a distinction it cannot measure.
The reference standard changes what “percent” means
Calibration converts instrument response into concentration using an assumed relationship between the sample and the standard. That relationship is especially important for botanical mixtures because no single small molecule represents every constituent equally.
Reporting results as catechin equivalents, procyanidin B2 equivalents, or grape seed reference-extract equivalents preserves essential information. Removing the word “equivalents” can make an operational assay result appear to be a direct compositional measurement.
Reference-material quality also matters. The certificate should establish the assigned value, purity or potency basis, storage requirements, and relevant moisture correction. For a reference extract, its characterization and value-assignment procedure are necessary to understand what calibration transfers to the sample.
There is no generally valid conversion factor between Folin–Ciocalteu, vanillin, DMAC, and acid-conversion percentages. Any conversion relationship must be demonstrated for the specified procedures and an appropriate range of representative materials. A relationship established for one composition may fail when monomer content, galloylation, or polymer distribution changes.
Sample preparation can shift the result before detection begins
The extraction step determines which constituents reach the reaction vessel or chromatographic column. Solvent composition, extraction time, mixing, temperature, and the sample-to-solvent ratio can affect recovery. Incomplete dissolution or selective extraction can alter both the measured content and the apparent distribution of chain lengths.
Filtration and cleanup also require evaluation. Adsorption to filters or sorbents can remove analytes selectively, while clarification may discard suspended material that contains part of the target fraction. A clear solution demonstrates suitability for measurement, not necessarily complete analyte recovery.
Reporting basis creates a separate difference. As-is results include the effect of the sample’s moisture or other measured volatile loss; dry-basis results correct for the specified loss. The calculation is:
Dry-basis content = as-is content ÷ (1 − moisture fraction)
The correction is only comparable when the moisture determination is appropriate and consistently defined. Loss on drying and water-specific measurements do not necessarily measure the same quantity, because loss on drying can include volatile substances other than water.
Carrier-containing powders need an explicit denominator as well. Content per gram of commercial powder is not the same as content per gram of native extract solids. An undeclared change between these bases can produce an apparent quality difference without any change in the native extract.
Making a certificate of analysis technically comparable
An entry such as “OPC ≥95%, UV” leaves too much undefined. “UV” describes a detection principle, not the reaction chemistry, calibration, extraction procedure, or calculation. Likewise, a reference to a pharmacopoeial or other published method should identify the applicable edition and any modifications; the method title alone does not establish that it measures the claimed oligomer fraction.
The supporting analytical package should make the following details available:
- Analyte definition: whether monomers and polymers are included, and any stated oligomer boundaries.
- Procedure identification: method reference, version, and deviations from the cited procedure.
- Calibration: reference-standard identity, assigned potency, calibration range, and equivalent units.
- Preparation and reporting basis: extraction conditions, cleanup, dilution, moisture correction, and treatment of carriers.
- Calculation rules: blank subtraction, integration boundaries, response factors, and the denominator used for percentages.
- Performance evidence: selectivity, precision, recovery, working range, and robustness relevant to the actual extract matrix.
For chromatographic claims, representative chromatograms, peak assignments, and treatment of unresolved fractions are particularly useful. For colorimetric methods, reaction timing and reagent conditions can be as important as the instrument settings.
When two laboratories disagree, retesting a shared, homogenized sample using the same documented procedure is more informative than comparing their existing certificates. Alignment must include standards, extraction, moisture basis, and calculations—not merely the assay name. Differences near an acceptance limit should be assessed against method precision and measurement uncertainty rather than interpreted automatically as a change in material quality.
Build the specification around the claim that needs support
A routine consistency specification and an oligomer-composition specification need not use the same analytical strategy. A validated colorimetric assay can be suitable for monitoring a controlled material when its operational meaning is explicit. A claim about a defined oligomer fraction requires evidence that distinguishes that fraction from monomers and polymers.
A useful combination is a clearly defined quantitative assay supported by a chromatographic identity or distribution profile. These measurements should retain their separate meanings rather than being forced into matching percentages.
The strongest OPC specification is not the one with the highest numerical threshold. It is the one that defines the target, measures it with demonstrated selectivity and performance, and produces comparable results across batches and laboratories. Until those conditions are met, a larger percentage is a larger reported response—not proof of more oligomeric proanthocyanidins.
Related Picks
 Butylated Hydroxytoluene Price Drivers: Supply, Purity, and Purchasing Risk FactorsOct 21, 2026Butylated Hydroxytoluene price trends depend on supply stability, purity, logistics, and purchasing risk. Learn how to compare quotes wisely and reduce sourcing costs.
 Sodium Tripolyphosphate Price Trends: Raw Material and Energy ExposureOct 20, 2026Explore sodium tripolyphosphate price trends, from phosphate and soda ash costs to energy exposure. Learn how to compare quotes, manage sourcing risks, and make smarter purchasing decisions.
 Acetonitrile Shipment to Vietnam Successfully Dispatched; RCEP Benefits Boost Fine Chemical Trade with ASEANSep 16, 2026A shipment of industrial-grade acetonitrile from our company has recently been loaded and dispatched following the completion of standardized hazardous material packaging and container securing procedures.
 Nigerian Client’s Order of 4 Containers of Vinyl Acetate Successfully Loaded and Shipped to West AfricaSep 16, 2026We recently completed the loading of a vinyl acetate order for a Nigerian client; four containers of the product have been successfully packed and are ready for shipment to Nigeria.
Question Consultation
Send Us Your Inquiry Today

Luxi Chemical is a professional chemical product supplier with ample stock of all chemical categories and excellent quality, welcome your purchase inquiry.